Dashboard tour — what every surface means
For: all
Tier: free+
Time: ~8 min
Why you'd do this
The dashboard concentrates a lot of state into a small area: four KPI cards, per-repo score rings, conditional banners (locked-repo, stale-evidence, fingerprint-change, profile-nudge, profiling-nudge), and a sidebar that gates by tier. Knowing which surface answers which question saves clicking through every menu the first time something looks unusual.
Before you start
- Completed the Quick Start (or have at least one repo + one scan)
- An EU AI Act mental model — Provider/Deployer/etc. (see Concept Primer)
Step 1
The four KPI cards across the top summarise account-wide compliance state.
| Card | What it counts | Click → |
|---|---|---|
| Non-Compliant | findings with status NON_COMPLIANT across all repos | /dashboard/issues filtered to NC |
| Compliant Repos | repos whose last scan is overall COMPLIANT | (no nav) |
| Human Gates | <filled> / <applicable> articles attested | /dashboard/human-gates |
| Compliance Score | weighted % across all repos | (no nav) |
Free / Starter accounts only see counts for their own repos. Member-only access (proInvited/businessInvited/freeInvited) includes repos the user was invited to.
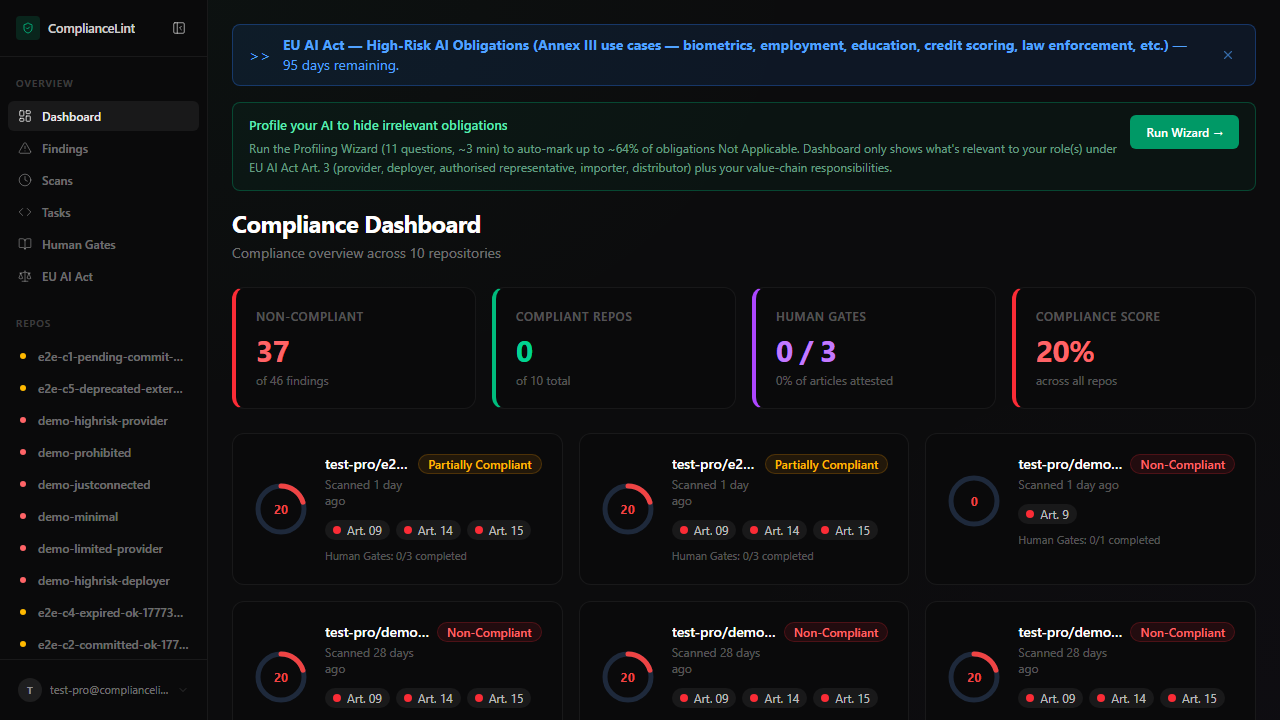
What you'll see: Four KPI cards in a single row on desktop, stacked 2x2 on tablet, stacked 1x4 on mobile. Each card tinted by severity (red for NC, emerald for clean, amber/red for low score).
Step 2
Below the KPI row sits the repo grid. Each card combines:
- Score ring — overall compliance %, colour-coded (≥80 emerald, 60-79 amber,
<60red) - Risk badge — high-risk / limited-risk / minimal-risk / prohibited / undefined (matches the repo's classification)
- Last scan time + status — relative timestamp; click the row to open the repo overview
- Stale dot — small amber dot if any evidence is past its TTL (see Compliance All-in-One Pack chapter for refresh)
Click anywhere on the card to enter that repo's detail tabs (Dashboard / Scans / Tasks / Human Gates / Settings).
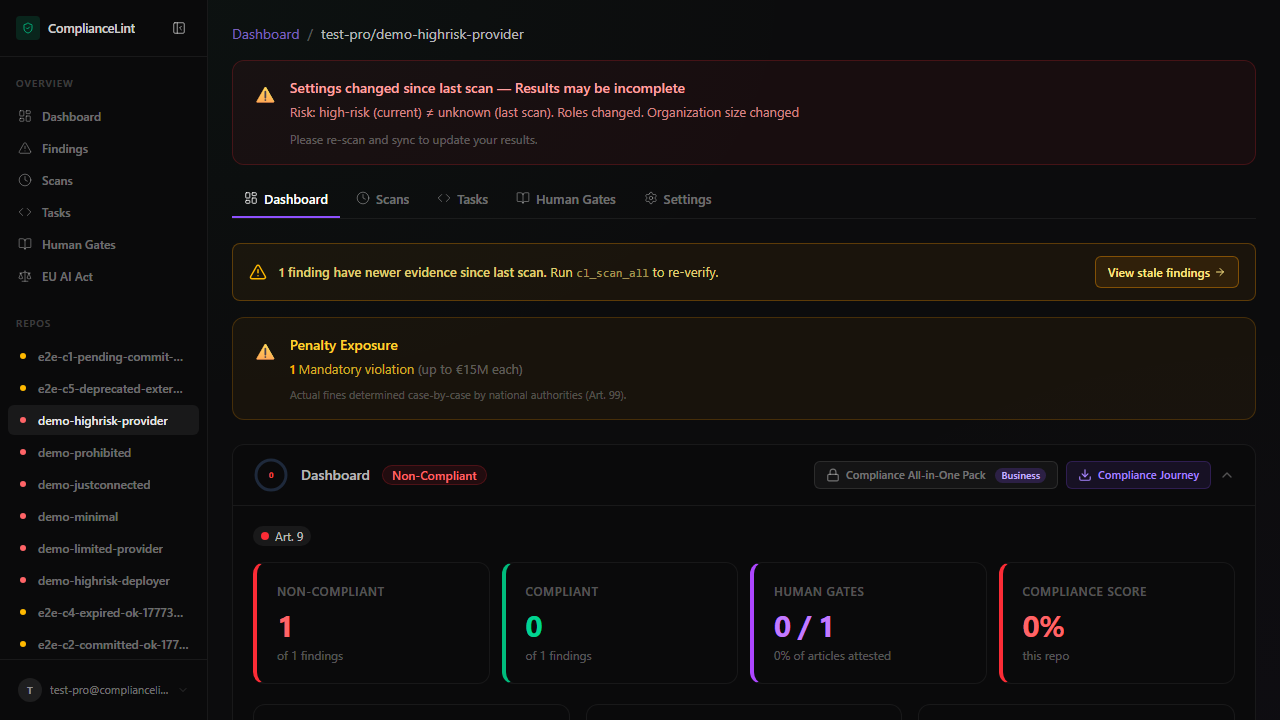
What you'll see: Per-repo overview tab with score ring + KPI breakdown for THAT repo, plus a recent-scans list below. The breadcrumb at the top shows Dashboard / <org>/<repo>.
Step 3
Several banners may appear above the KPI row, each gated on real state — not promotional content. The most common four:
- Locked-repo banner (red) — your account's
maxReposlimit is exceeded after a downgrade; some repos are read-only until you upgrade or unlink one - Onboarding wizard (only when steps remain) — clickable checklist that links to step-completion pages
- Compliance Profile nudge (blue) — your account has no
legal_nameset, so generated PDFs use the placeholder "Your Company". 1 minute to fill - Profiling Wizard nudge (emerald) — Starter+ tier and no owned repo has wizard answers yet; running the wizard auto-marks up to ~64% of obligations Not Applicable
Each banner disappears as soon as its underlying condition is satisfied — no manual dismiss state.
Step 4
The left sidebar (or hamburger drawer on mobile) groups navigation by scope:
- OVERVIEW — Dashboard, Findings, Scans, Tasks, Human Gates, EU AI Act browser. These are cross-repo aggregations
- REPOS — every repo you can access (owned + invited). The active repo is highlighted; click another to switch context
- User menu (bottom-left) — Settings, Team, Plans, Regulation Updates, Sign out. Demo persona hides this menu (sample-data view)
Some items gate by tier: Human Gates fill is Pro+, Compliance All-in-One Pack export is Business+. Lower tiers see the entry but click into an upgrade prompt. Regulation Updates is open to all logged-in tiers (§2.AF re-tier 2026-05-05 — content is public EU intel; email digest + filtering remain Business+ roadmap).
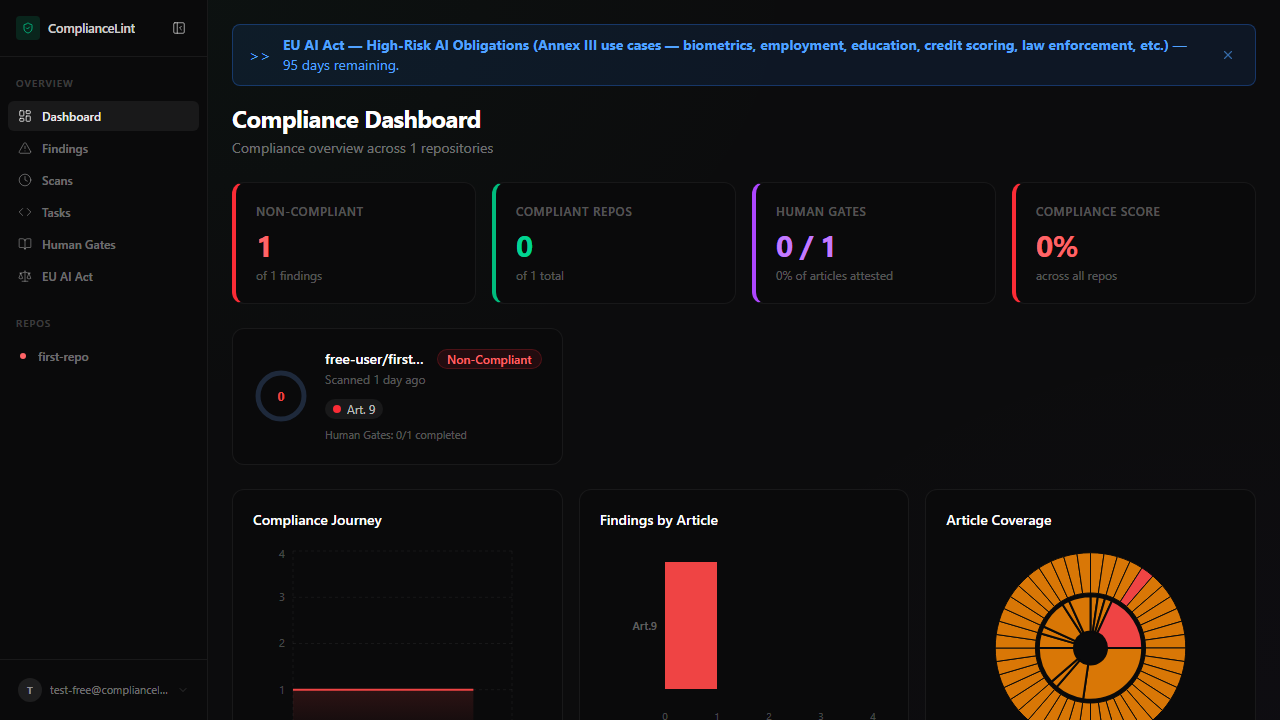
What you'll see: Free tier dashboard sidebar — same OVERVIEW group; Human Gates renders an upgrade prompt on click. Regulation Updates opens the full timeline (§2.AF re-tier 2026-05-05).
Step 5
On viewports narrower than ~768 px the sidebar collapses behind a hamburger button. The KPI row stacks 1-column, repo cards become full-width, and banners truncate the long copy with a "Read more" affordance. All actions remain reachable — none are desktop-only.
If you've inherited a repo from a team owner, the mobile sidebar still shows it under REPOS — switching context works identically across viewports.

What you'll see: Hamburger button top-left, KPI cards stacked vertically, repo list below. The user menu is reached via the hamburger drawer.
What can go wrong
- KPI cards show 0 for everything even though I just synced a scan — The dashboard reads from the latest sync per repo. If the sync was interrupted or the API key was revoked mid-sync, only the scan envelope may have persisted without the per-finding rows. Ask your AI to sync again — the operation is idempotent.
- A red "Locked repo" banner appears but I haven't downgraded — An invited member's view of the OWNER's tier is what gates lock state. If the owner downgraded (Pro → Free), every member of the owner's repos sees this banner. The fix is on the owner's account, not yours — ask them to upgrade or release the repo.
- Profiling Wizard nudge keeps showing even after I ran the wizard — The nudge clears when ANY owned repo has at least one wizard answer set. If you ran the wizard against a repo someone invited you to (member access, not owner), the nudge persists for your OWNED repos. Run the wizard from one of your own repos to clear it.
Related
Last updated: 2026-06-15